CARPETS
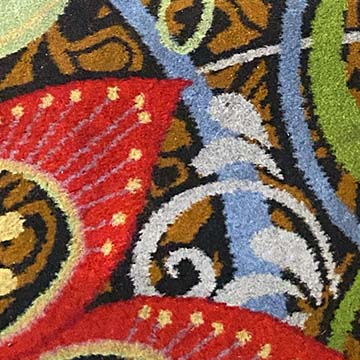
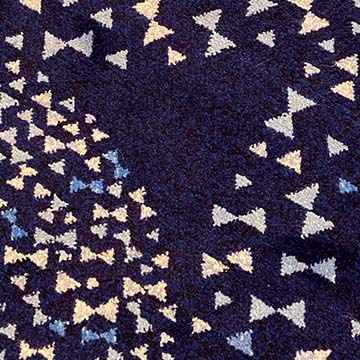
Who the fuck cares about ugly-ass casino carpets, right? Apparently, a few people—me included. Here's some of the ones we've admired over the course of many trips to the Las Vegas Valley since 2011.
UPCOMING • California • Skyline • Suncoast
Note: I did not design any of the carpets represented here; nor do I take comissions for carpet design.
MAPS
Maps showing relative locations of casinos on The Strip, Downtown, and Local Las Vegas Valley casinos.


APPENDIX
Alphabetical list of casino stats including gaming floor square footage, number of hotel rooms, convetion center size, and years opened and closed.
| Name | Casino (ft2) | Hotel (rooms) | Convention (ft2) | Opened | Closed |
|---|---|---|---|---|---|
| Aria | 150,000 | 4,004 | 300,000 | 2009 | — |
| Arizona Charlie’s Boulder | 35,000 | 301 | — | 2001 | — |
| Bally's | 68,375 | 2,812 | 40,000 | 1973 | 2022 |
| Bellagio | 156,000 | 3,950 | 45,000 | 1998 | — |
| Binion’s | 77,800 | 81 | — | 1951 | — |
| Cannery | 78,967 | 201 | 7,000 | 2003 | — |
| Caesars Palace | 124,181 | 3,960 | 300,000 | 1966 | — |
| Casino Royale | 17,500 | 152 | — | 1978 | — |
| Circa | 100,152 | 512 | 35,000 | 2020 | — |
| Circus Circus | 123,928 | 3,773 | 21,000 | 1968 | — |
| The Cosmopolitan | 110,000 | 3,027 | 150,000 | 2010 | — |
| The D | 42,000 | 638 | 11,000 | 2012 | — |
| Downtown Grand | 24,085 | 629 | 3,500 | 1964 | — |
| Durango | 83,178 | 211 | 20,000 | 2023 | — |
| Eastside Cannery | 35,000 | 307 | — | 2008 | TEMPORARILY |
| El Cortez | 41,842 | 364 | — | 1941 | — |
| Encore | 74,000 | 2,034 | 60,720 | 2008 | — |
| Excalibur | 93,000 | 3,981 | — | 1990 | — |
| Flamingo | 72,299 | 3,460 | 73,000 | 1946 | — |
| Fontainebleau | 173,000 | 3,700 | 550,000 | 2023 | — |
| Four Queens | 27,269 | 690 | — | 1966 | — |
| Fremont | 42,000 | 447 | 7,330 | 1956 | — |
| Green Valley Ranch | 143,891 | 495 | 65,000 | 2001 | — |
| Golden Nugget | 38,000 | 2,419 | 37,000 | 1946 | — |
| Hard Rock | 61,740 | 1,506 | 86,337 | 1995 | 2020 |
| Harrah's | 88,800 | 2,540 | 25,000 | 1973 | — |
| Horseshoe | 61,100 | 2,056 | 40,000 | 2023 | — |
| The Linq | 39,100 | 2,252 | 31,034 | 2014 | — |
| Luxor | 104,000 | 4,407 | 35,000 | 1993 | — |
| M Resort | 92,000 | 390 | 60,000 | 2009 | — |
| Main Street Station | 28,500 | 452 | — | 1978 | — |
| Mandalay Bay | 147,992 | 3,209 | 2,000,000 | 1999 | — |
| Margaritaville | 15,000 | — | — | 2011 | 2019 |
| Mermaids | 7,000 | — | — | 1999 | 2016 |
| MGM Grand | 171,500 | 6,852 | 850,000 | 1993 | — |
| The Mirage | 90,548 | 3,044 | 152,000 | 1989 | — |
| Monte Carlo | 76,982 | 2,700 | 17,000 | 1996 | 2018 |
| New York-New York | 81,000 | 2,024 | 30,500 | 1997 | — |
| NoMad | ~5,000 | 300 | — | 2018 | — |
| O'Shea's | 5,000 | — | — | 1989 | — |
| The Orleans | 135,000 | 1,886 | 60,000 | 1996 | — |
| Palace Station | 126,085 | 576 | 18,000 | 1976 | — |
| The Palazzo | 105,000 | 3,068 | — | 2007 | — |
| Palms | 94,840 | 1,302 | 20,000 | 2001 | — |
| Paris Las Vegas | 95,263 | 2,916 | 140,000 | 1999 | — |
| Park MGM | 66,000 | 2,700 | 60,000 | 2018 | — |
| Planet Hollywood | 64,470 | 2,494 | 88,000 | 2000 | — |
| Plaza | 82,500 | 995 | 19,000 | 1971 | — |
| Primm Valley | 37,779 | 624 | — | 1990 | — |
| Rampart | 57,610 | 548 | 115,900 | 1999 | — |
| Red Rock | 118,309 | 796 | 100,000 | 2006 | — |
| Resorts World | 117,000 | 3,506 | 300,000 | 2021 | — |
| Rio | 117,330 | 2,520 | 160,000 | 1990 | — |
| Sahara | 50,662 | 1,616 | 80,000 | 1952 | — |
| Sam’s Town | 120,000 | 646 | 51,477 | 1971 | — |
| Slots-A-Fun | 17,700 | — | — | 1971 | — |
| SLS Las Vegas | 56,000 | 1,620 | 45,000 | 2014 | 2019 |
| South Point | 137,232 | 2,163 | 175,000 | 2005 | — |
| The Strat | 80,000 | 2,427 | 25,000 | 2019 | — |
| Sunset Station | 162,173 | 448 | 13,000 | 1997 | — |
| Treasure Island | 95,000 | 2,884 | 30,500 | 1993 | — |
| Tropicana | 44,570 | 1,467 | 72,000 | 1957 | 2024 |
| The Venetian | 120,000 | 4,049 | 2,250,000 | 1999 | — |
| Virgin | 60,000 | 1,505 | 130,000 | 2021 | — |
| Westgate | 54,923 | 2,956 | 225,000 | 1969 | — |
| Wynn | 111,000 | 2,716 | 500,000 | 2005 | — |


